Optical test step by step
It is important to follow a few rules to calibrate a lens.
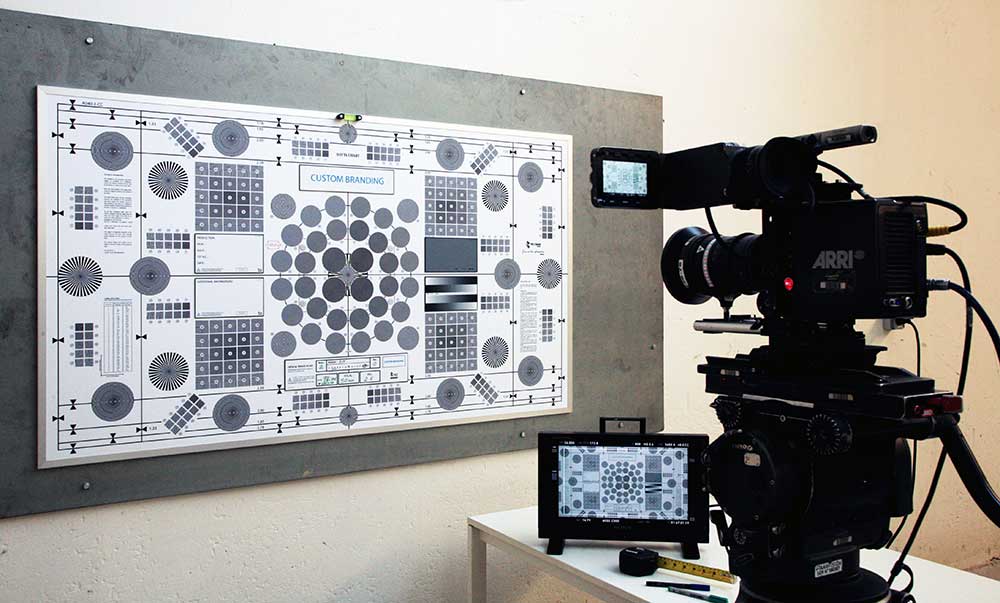
On this page, you’ll find the standard procedure for an optical calibration test. Thanks to the very hi-res printing and its numerous adjustment tools, the charts by Prêt À Tourner will provide you with maximum comfort and fast performance.
You’ll be able to calibrate your lenses very precisely and be sure of their reliability at any shooting distances and any stops.
You can also define very easily and very precisely the resolution of your lenses and make informed decisions about mixing different brands or models of lenses for your shoots.
To know more about the P.A.T. test patterns
P.A.T. focus charts allow you to check the resolution of your camera’s sensor or lens mathematically. In order to do so, use the numbers of each circular and linear target.

The numbers indicated on concentric and linear targets stand for, in twentieth of a millimeter, the number of pairs of lines printed on 1 mm.
The degree of sharpness depends on the clarity between the lines.
The resolving power depends on the number of lines seen.
The table above gives you the correlation between the numbers in the concentric and linear targets, the number of pairs of lines printed on the chart on 1 millimeter, and the number of pairs of lines printed on the film or sensor on 1 millimeter.
Correlation table
Prêt À Tourner provides you with a correlation table, allowing you to interpret the numbers of the targets.
To use this correlation table, place the chart at a distance from the image plane of 50 times the focal length of the lens in test.
When filming the target at a distance of 50 times the focal lenght.
| Chart number | Pairs of lines / mm on the chart | Pairs of lines / mm on the sensor |
| 4 | 5 | 250 |
| 5 | 4 | 200 |
| 6 | 3,333 | 166,667 |
| 7 | 2,857 | 142,857 |
| 8 | 2,5 | 125 |
| 9 | 2,222 | 111,111 |
| 10 | 2 | 100 |
| 11 | 1,818 | 90,909 |
| 12 | 1,666 | 83,333 |
| 13 | 1,538 | 76,923 |
| 14 | 1,429 | 71,429 |
| 15 | 1,333 | 66,666 |
| 16 | 1,25 | 62,5 |
| 17 | 1,176 | 58,824 |
| 18 | 1,111 | 55,555 |
| 19 | 1,053 | 52,632 |
| 20 | 1 | 50 |
| 21 | 0,952 | 47,619 |
| 22 | 0,909 | 45,455 |
| 23 | 0,87 | 43,478 |
| 24 | 0,833 | 41,666 |
| 25 | 0,8 | 40 |
| 26 | 0,769 | 38,462 |
| 27 | 0,741 | 37,037 |
| 28 | 0,714 | 35,714 |
| 29 | 0,69 | 34,483 |
| 30 | 0,666 | 33,333 |
| 31 | 0,645 | 32,258 |
| 32 | 0,625 | 31,25 |
| 33 | 0,606 | 30,303 |
| 34 | 0,589 | 29,412 |
| 35 | 0,571 | 28,571 |
| 36 | 0,555 | 27,777 |
| 37 | 0,541 | 27,027 |
| 38 | 0,526 | 26,316 |
| 39 | 0,513 | 25,641 |
| 40 | 0,5 | 25 |
| 41 | 0,488 | 24,39 |
| 42 | 0,476 | 23,81 |
| 43 | 0,465 | 23,256 |
| 44 | 0,455 | 22,727 |
| 45 | 0,444 | 22,222 |
| 46 | 0,435 | 21,739 |
| 47 | 0,426 | 21,277 |
| 48 | 0,417 | 20,833 |
| 49 | 0,408 | 20,408 |
| 50 | 0,4 | 20 |
| 55 | 0,364 | 18,182 |
Place the camera at the required distance from the chart.
To use this correlation table, place the chart at a distance from the image plane of 50 times the focal length of the lens in test.
Here is an example for a 50 mm lens :
50 x 50 = 2500 mm = 2,5 meters = 8 feet

Perfectly adjust the camera position
The Prêt À Tourner mirror centering aid (supplied with P.A.T. workshop charts or available in shops) helps you to center the camera with the chart. This smart tool is very useful and provides you with the most precise results.
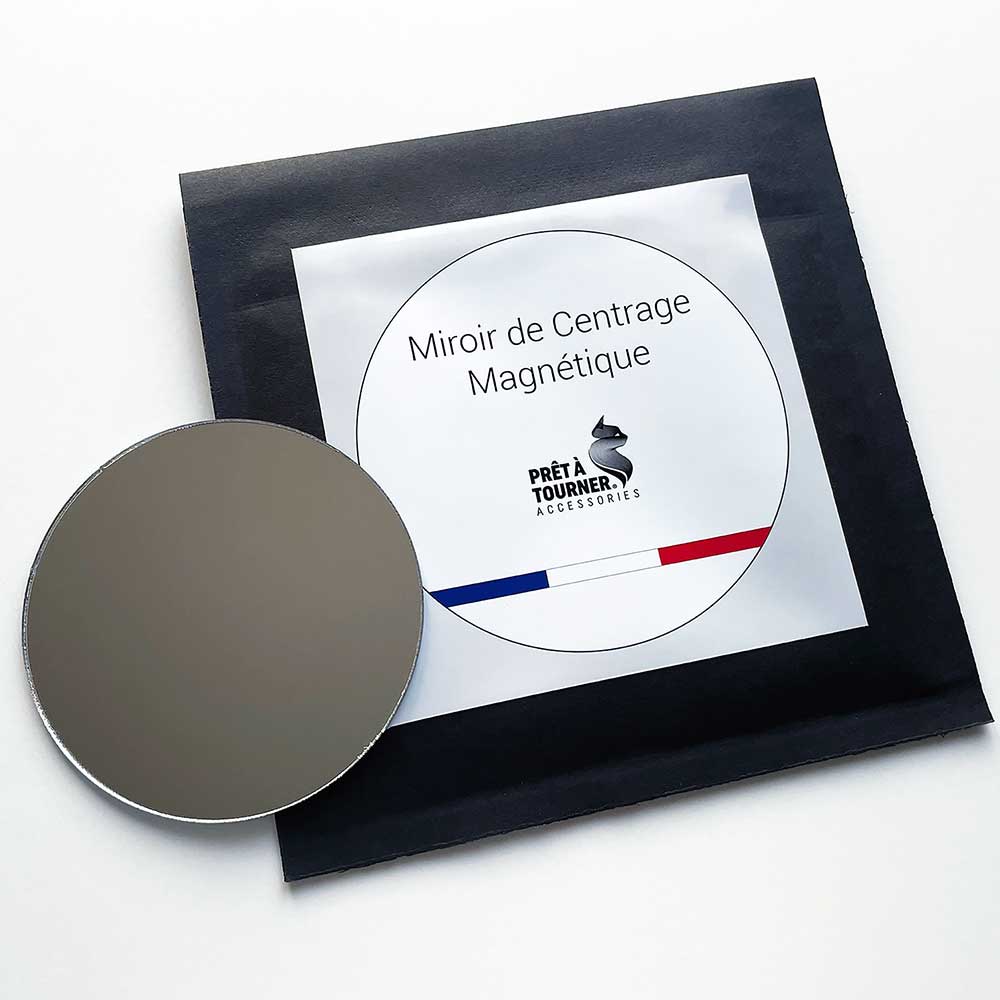
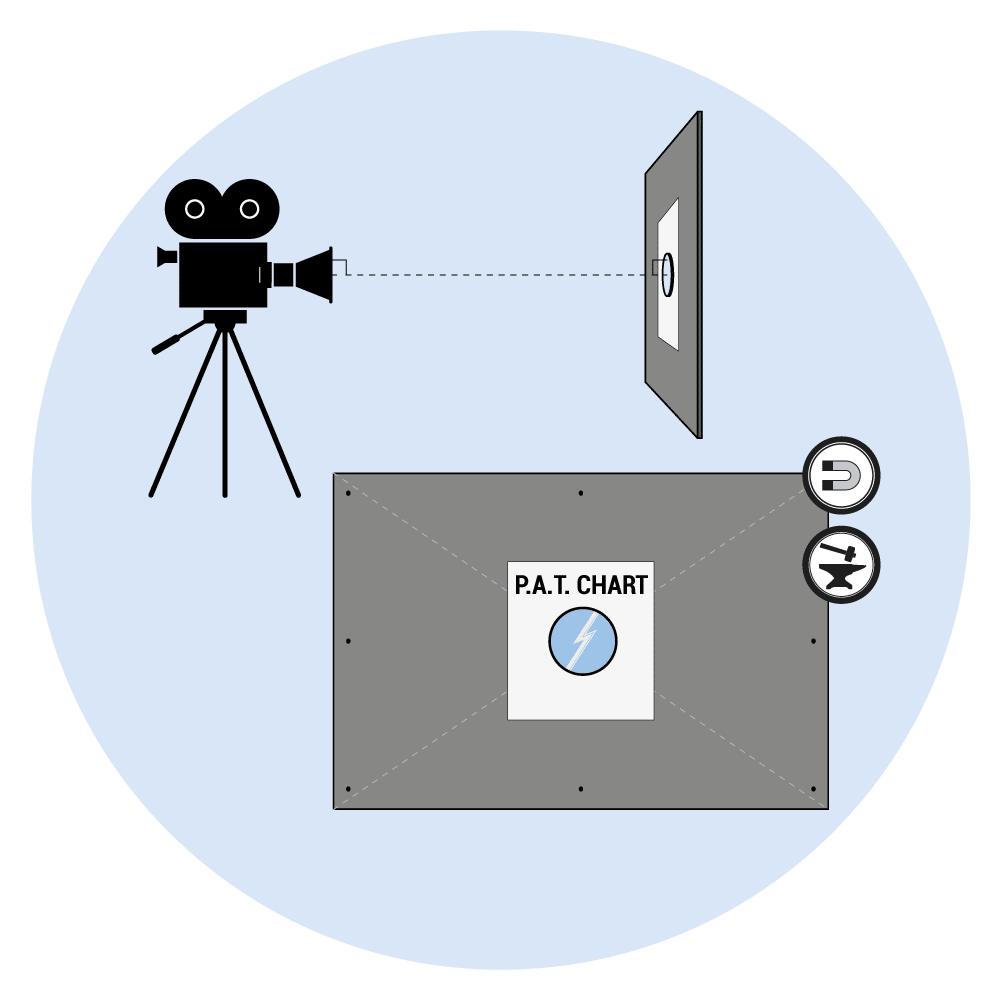
- Place the magnetic mirror on the center of the chart.
- Place the camera approximately at the required distance from the chart (as seen previously).
- Frame the center of the lens reflection in the mirror.
- In doing so, the optical axis* grows perfectly perpendicular to the chart. As the optical axis is by definition perpendicular to the sensor, the test chart and the sensor become 2 perfectly parallel planes.
- Because you frame the center of the chart, the center of the sensor is equidistant to the 4 corners of the chart.
- Last but not least, adjust precisely the distance with the sliding plate.
* Optical axis: also called the axis of symmetry of the optical system, the optical axis is an “imaginary line” passing through the center of the lens (called the optical center) and perpendicular to the plane of the lens.
P.A.T. Optical Wedge Scale
You’ll need the Prêt À Tourner Optical Wedge Scale for your test (supplied with P.A.T. workshop charts or available in shops).
The optical wedge scale, tools developped by Prêt À Tourner, enables you to optimally define the results of the sharpness test.
Thanks to this tool and to the target numbers, you can calibrate your lenses with an extreme precision and quantify their resolution.

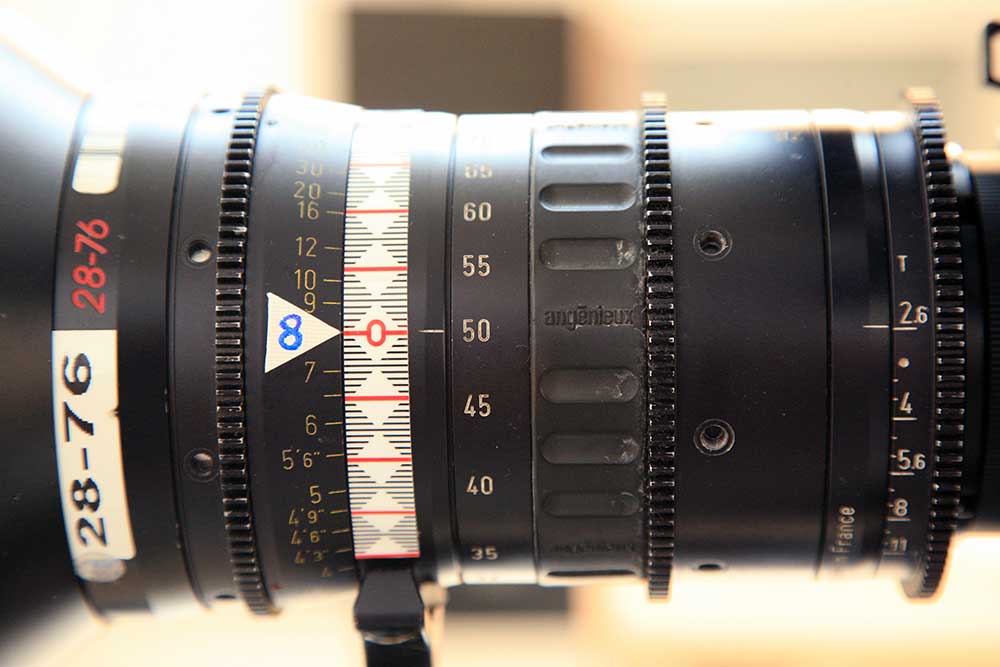
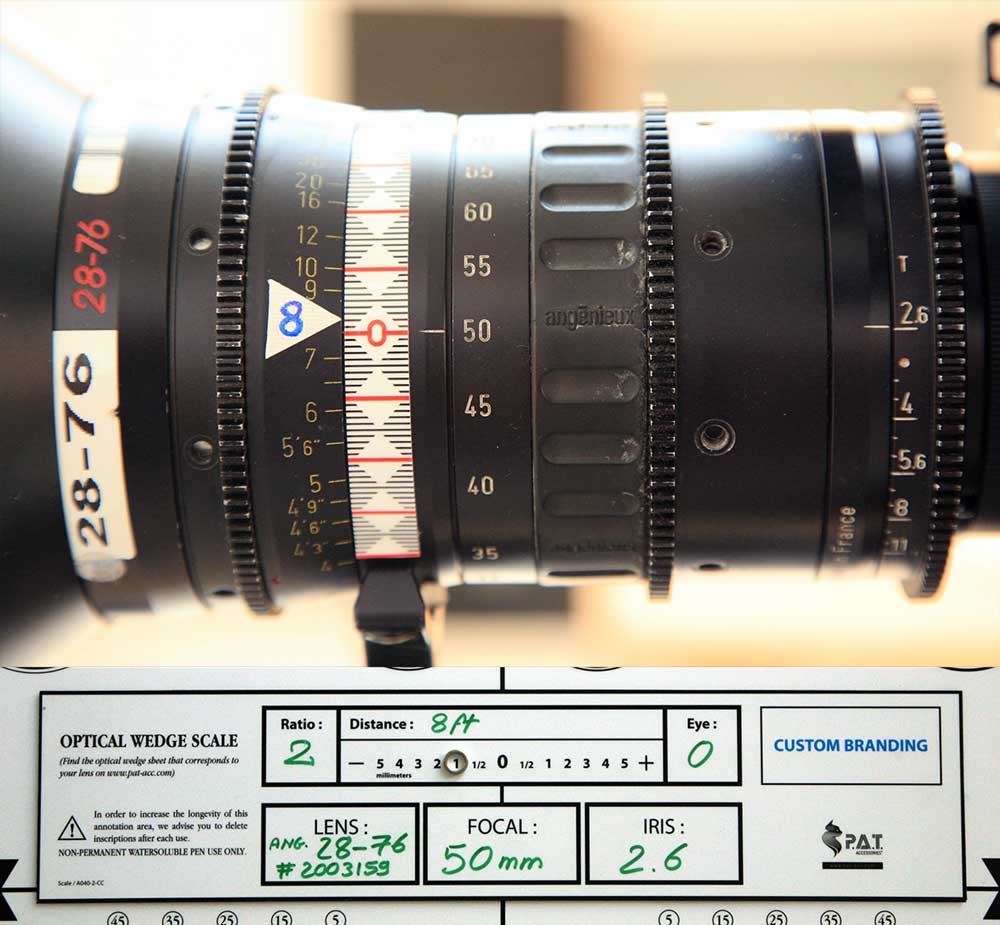
Stick the center (“0”) of a P.A.T. self-adhesive graph paper (supplied with P.A.T. workshop charts or available in shops) on the engraved reference mark of the lens. Use a pen or the magnets supplied by P.A.T.

Write down the technical information

Write the information about the tested lens in the corresponding areas: brand, serial number, focal, stop.
For this example, we are testing the zoom Angénieux 28-76, serial number #2003159, focal length 50 mm, stop wide open 2.6 (test your lens with the diaphragm at full aperture).

Position the camera at the recommended distance from the test chart.
Here 50 mm x 50 = 2500 mm = 8 feet.
Scale
The measurement unit of the scale is based on millimeters. It goes from -5 mm to + 5 mm and corresponds to the variation of the lens ring in the minus or in the plus direction around the correct testing distance of the lens.

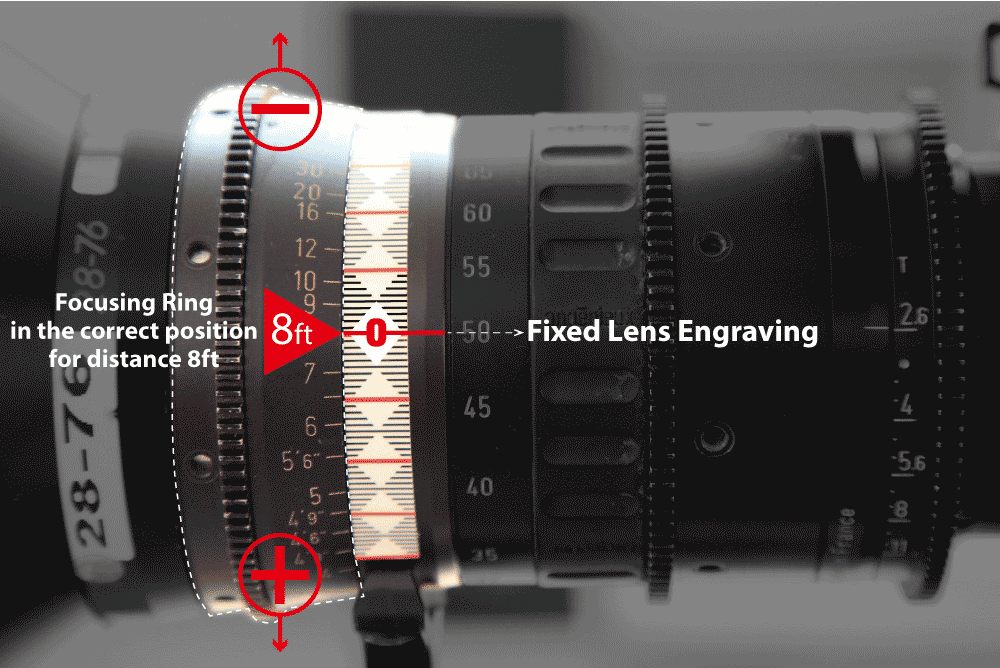
Focus ring of the lens in the right position for a distance of 8 feet.

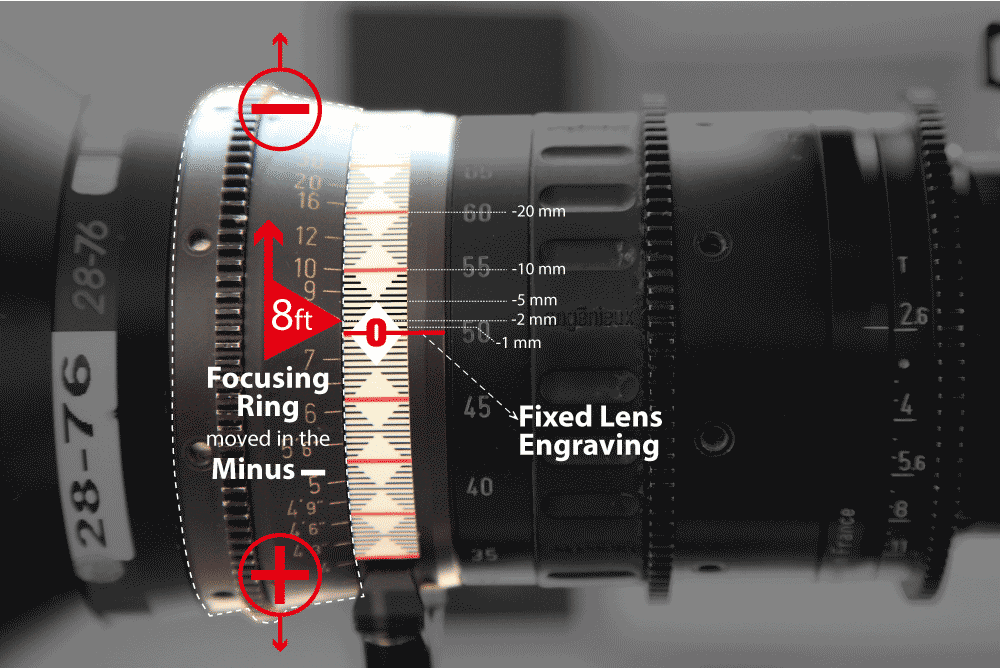
Focus ring shifted by 2 mm in the “minus” direction.

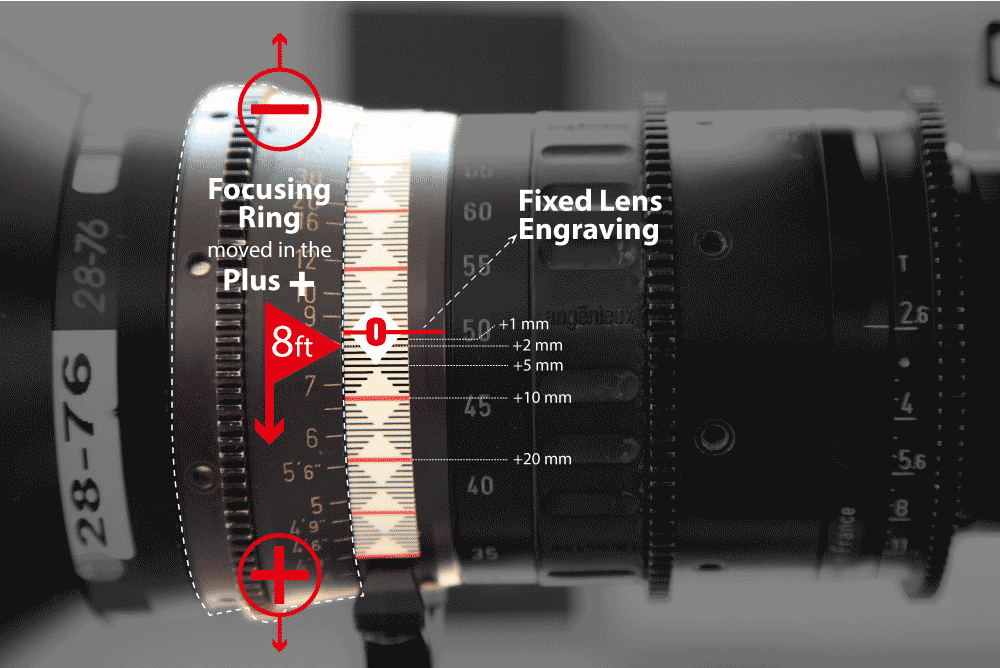
Focus ring shifted by 2 mm in the “plus” direction.

The ratio
The ratio is a multiplying number used to increment the gap of the movement (in the “minus” or in the “plus” direction), in millimeters, of the focus ring.

Depth of field is inversely proportional to focal length. The higher is the focal lenght, the smaller is the depth of field. And the smaller it is, the larger is the depth of field.
The depth of field also depends on the aperture displayed on the lens. The tighter is the diaphragm, the larger is the depth of field. The more open it is, the thiner is the depth of field.
Shifting the focus ring by 1 mm on a short focal length (often below 35 mm) or on a lens with a high aperture may therefore have no effect on the sharpness of the image of a subject (in this case the chart) at a given distance.
In this case, it may be useful to use a multiplier ratio to increment the gap (in millimeters) of the focus ring.
Example of correlation between the optical wedge scale, focus ring and a ratio of 2 :
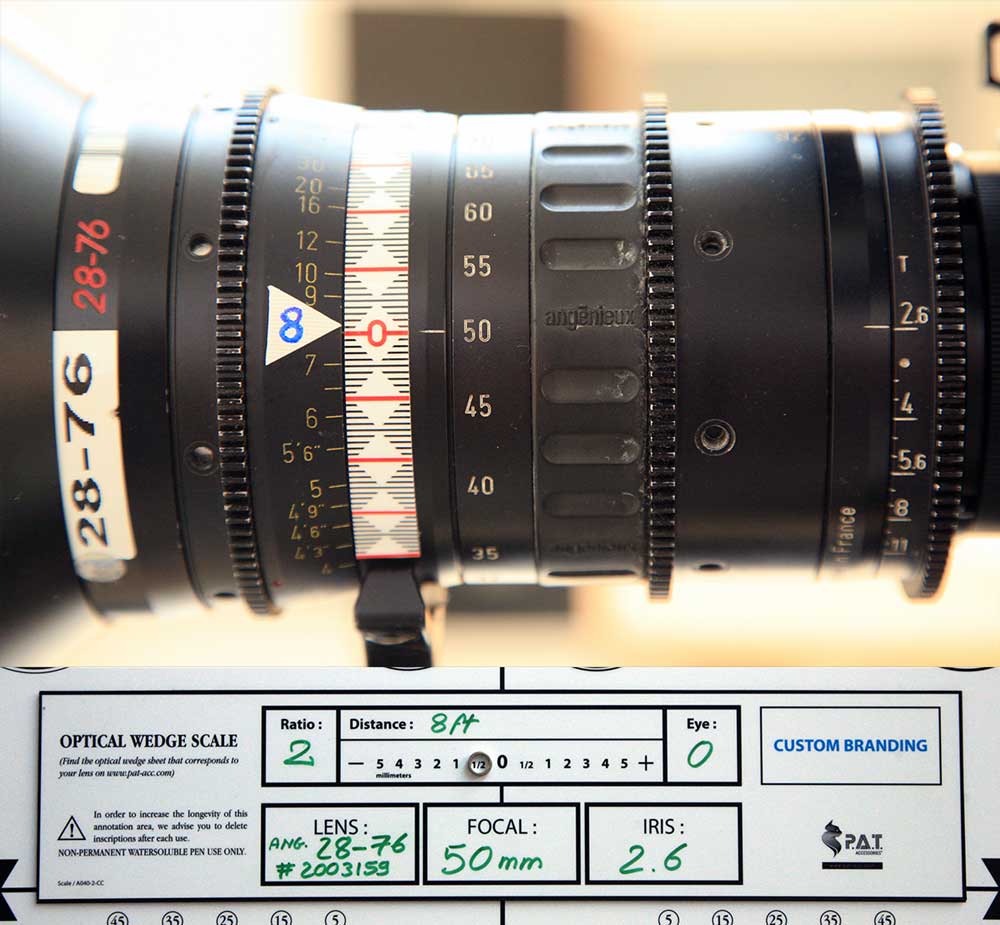
- Gap on the optical wedge scale: -0.5
- Multiplier ratio: 2
- Gap on the focus ring: -1 mm (= -0.5 x 2)
- Gap on the optical wedge scale: -1
- Multiplier ratio: 2
- Gap on the focus ring: – 2 mm (= -1 x 2)

- Gap on the optical wedge scale: -2
- Multiplier ratio: 2
- Gap on the focus ring: -4 mm (= -2 x 2)
Eye reading
Write in the « eye » area the best focus reading (useful when it comes to calibrating the viewfinder of film cameras).
In this example, the best reading with the eye is at 0- (slight tendency in the minus on the focus ring).

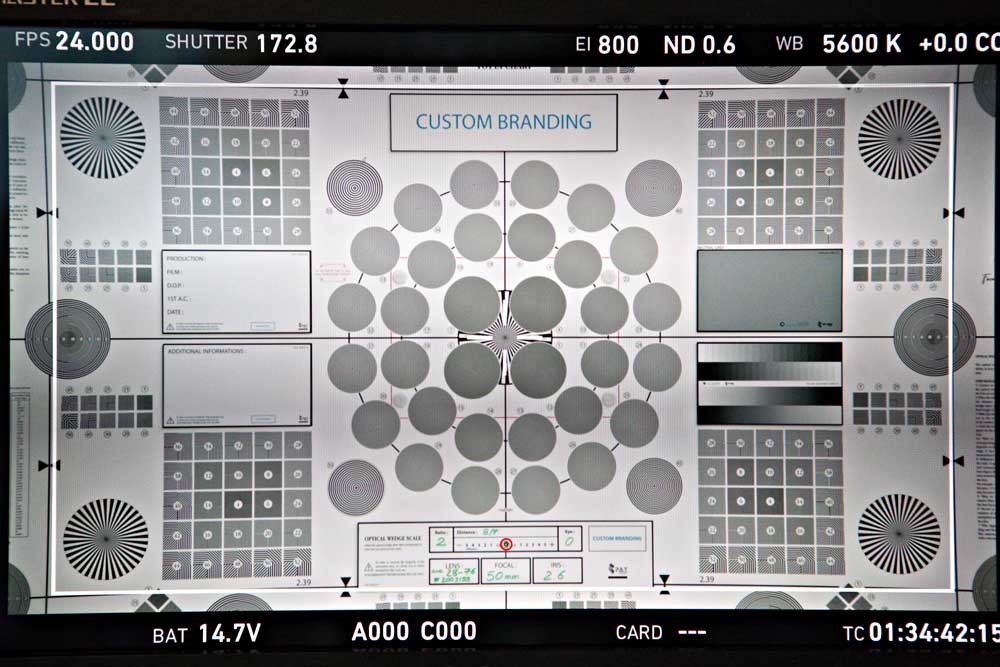
Start of optical test
The previous knowledge acquired, the test of a lens will prove all the easier and faster.
Let’s recap:
- place the chart at a distance from the image plane of 50 times the focal length of the lens in test.
- Center the camera precisely using the mirror centering aid.
- Stick the center of a P.A.T. self-adhesive graph paper on the engraved reference mark of the lens.
- Make sure you are filming correctly the test chart and the optical wedge scale (often positioned below the test pattern).
- Note the best eye reading on the optical wedge scale.
- Use an erasable pen and the magnets supplied to write the information on the optical wedge scale.
Test procedure :
The idea is to shoot a series of short films lasting 2 or 3 seconds, each time moving the focus ring. The result is a 20-second film that can be used to analyze the precise calibration of a lens and the resolution of an optical system.
- Place the magnet (supplied with the Prêt À Tourner graph paper) or mark the first measurement on the optical scale with a pen. Start with -5.
- Shift the lens focusing ring in relation to this measurement. Take into consideration the multiplier ratio.
- Record or print a few frames (2 or 3 seconds).
- Circle the next measurement (-4), shift the lens ring and record again for a few seconds.
- Do this up to +5. The result is a film lasting around 30 seconds.
Test example:
- Angénieux 28-76 mm optics.
- 50 mm focal length
- Diaphragm 2.6
- Distance 8 feet
- Ratio 2
- Camera ARRI ALEXA MINI
- Monitor SONY OLED PVM A170 HD

Optical wedge scale: -5
Lens focus ring: 10 mm

Optical wedge scale: -4
Lens focus ring: 8 mm

Optical wedge scale: -3
Lens focus ring: -6 mm

Optical wedge scale: -2
Lens focus ring: -4 mm

Optical wedge scale: -1
Lens focus ring: -2

Optical wedge scale: -0.5
Lens focus ring: -1 mm

Optical wedge scale: 0
Lens focus ring: 0 mm

Optical wedge scale: +0.5
Lens focus ring: +1 mm

Optical wedge scale: +1
Lens focus ring: 2 mm

Optical wedge scale: +2
Lens focus ring: +4 mm

Optical wedge scale: +3
Lens focus ring: +6 mm

Optical wedge scale: +4
Lens focus ring: +8 mm

Optical wedge scale: +5
Lens focus ring: 10 mm
Test reading and analysis
Digital cameras
Play your recording and easily spot the best result on the monitor.
Film cameras
Analyze the frames once developed (negative) with a microscope to find the best result.
Video of the optical calibration test
Watch each short video corresponding to a different position of the focus ring (-5, -4, -3, …) and spot the sharpest test pattern.
As a reminder:
- The degree of sharpness depends on the clarity between the lines.
- The resolving power depends on the number of lines seen.
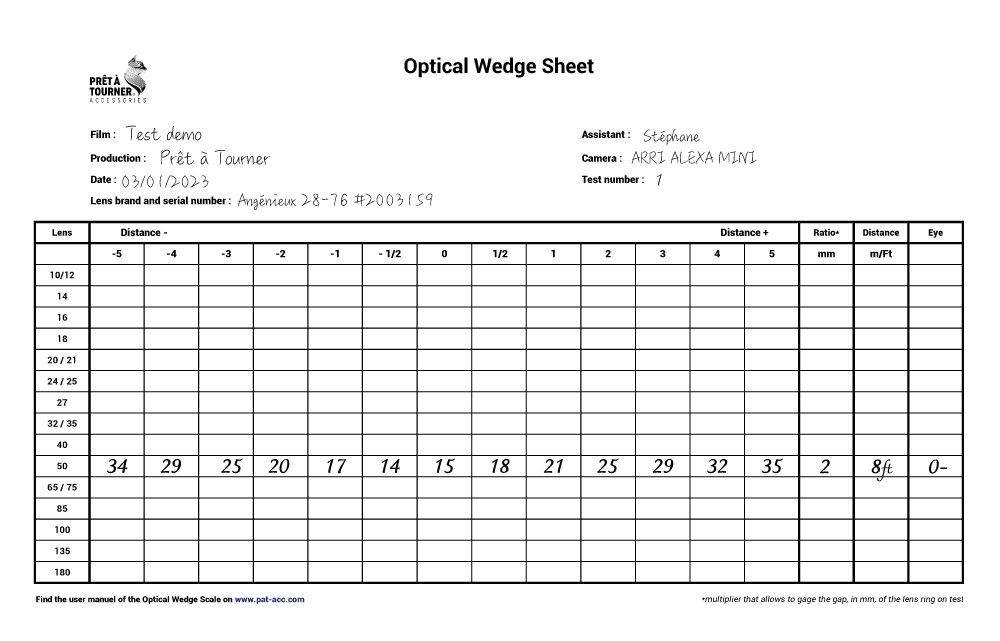
Transfer the numbers of the test patterns to the optical wedge sheet.
Conclusion of the test
Optical calibration test

The best readings are at -0.5 (test pattern 14) and -1 (test pattern 15). This corroborates the eye reading of 0 minus (0 -).
Resolution test
Correlation table
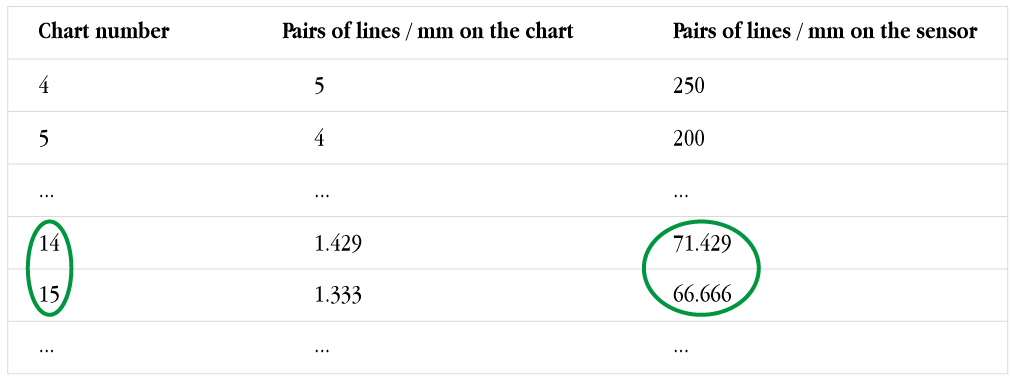
This shooting arrangement (ARRI ALEXA MINI camera, Angénieux 28-76 #2003159 optics, read on SONY OLED PVM A170 HD monitor) presents a resolution of about 70 line pairs per millimetre on the sensor.
